


What Happens After A Fed Rate Hike? (Or Pause)?
The Federal Reserve (Fed) has been all over the headlines recently, as they continue to raise interest rates. You may have kept up with the news, but you could be wondering why does this matter to me?
This article by YCharts cuts through the noise and explains:
-
The fundamentals of the Federal Reserve and their purpose
-
How rising interest rates affect bonds, stocks, and consumers
-----
What Happens After A Fed Rate Hike? (Or Pause)?
Investors might finally be able to unfasten their seatbelts, as it appears interest rates may have reached their cruising altitude.
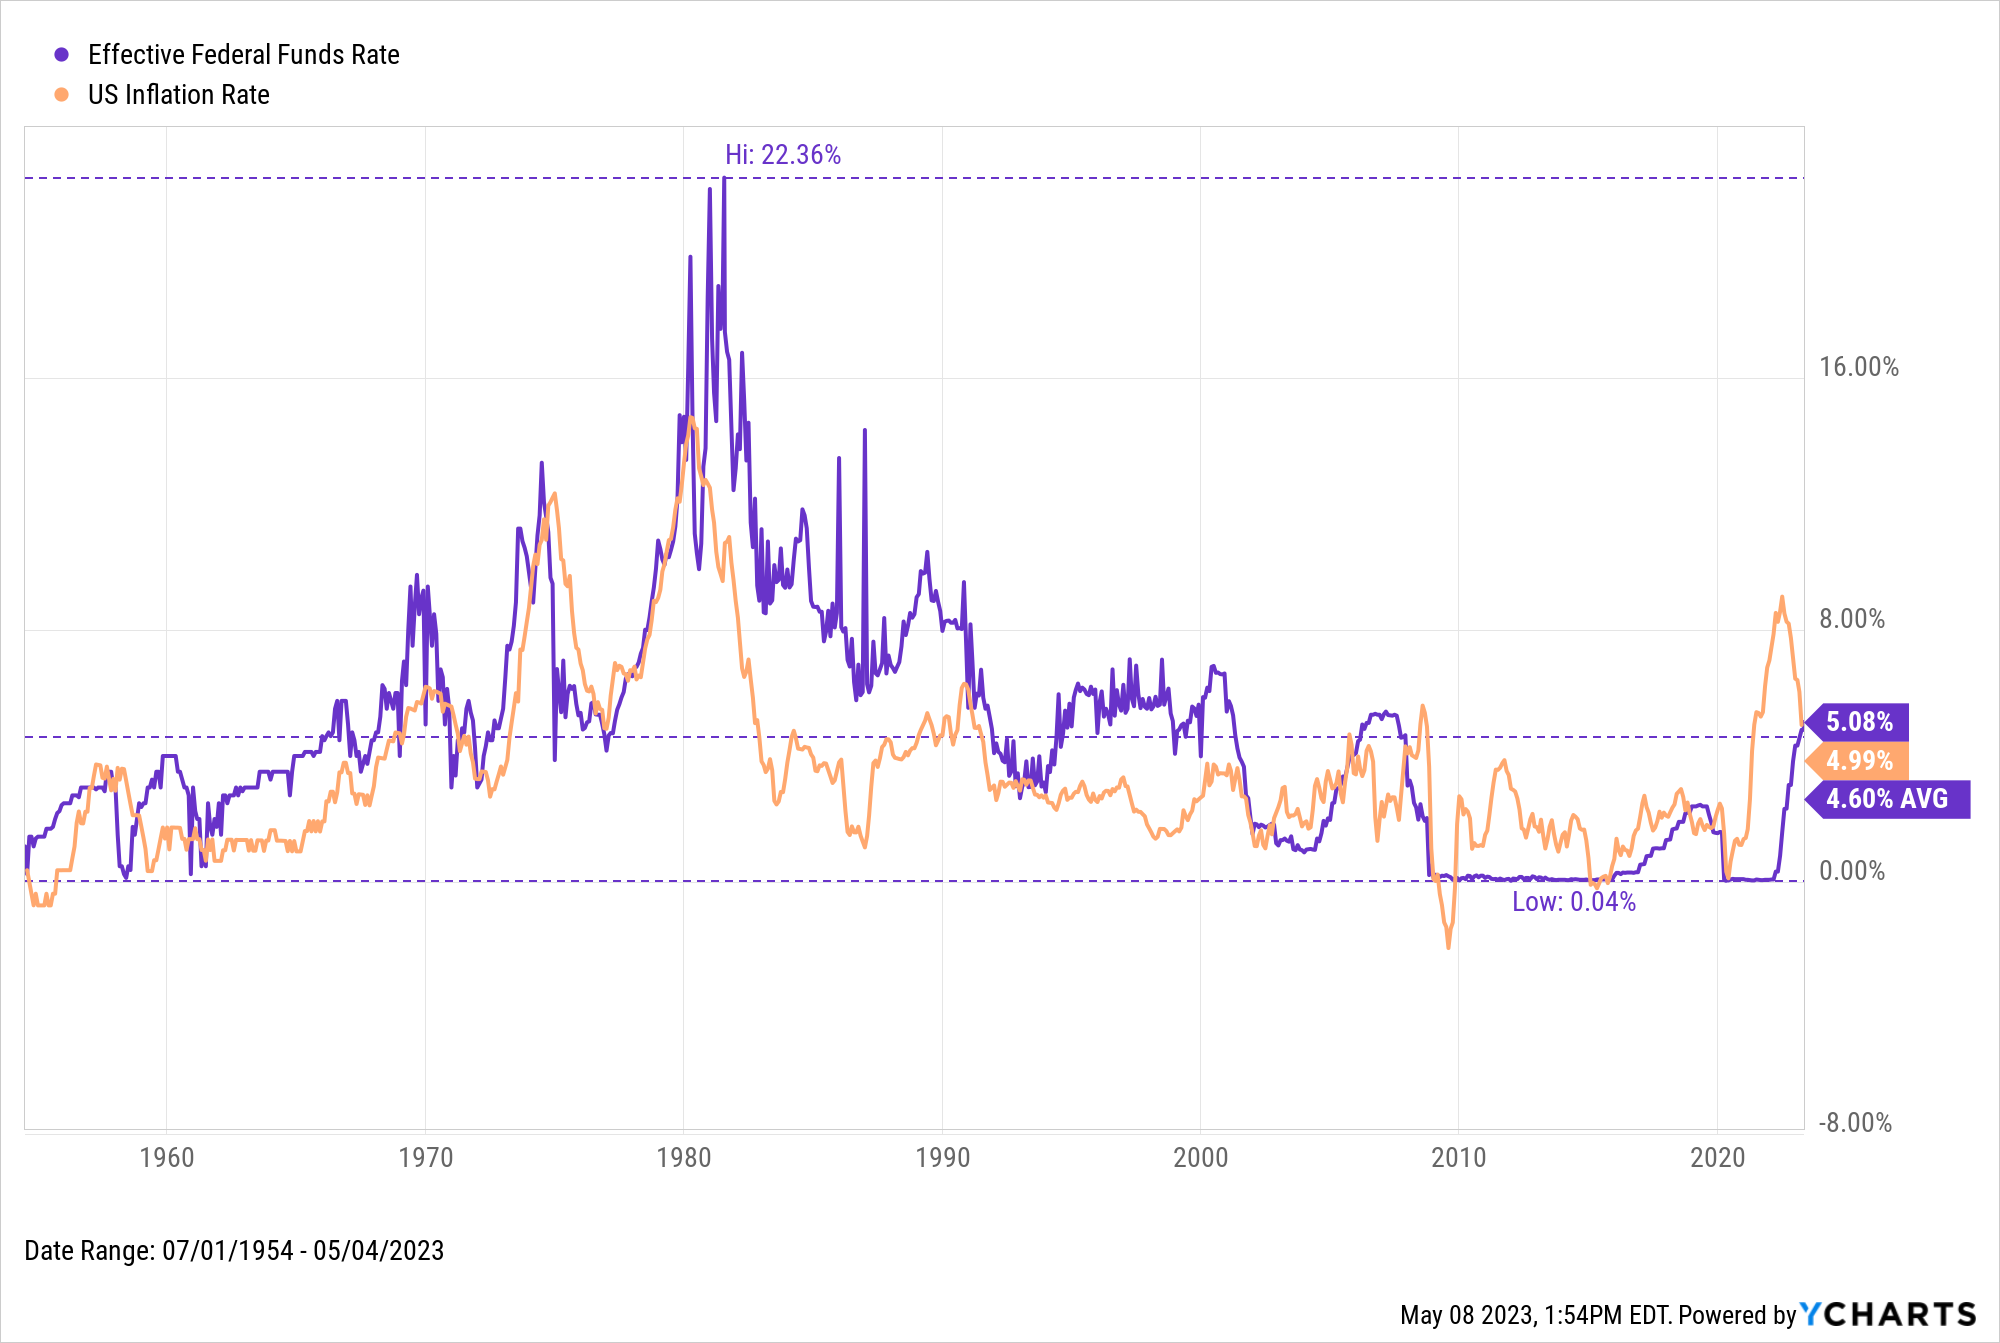
In May 2023, Fed Chair Jerome Powell and the FOMC voted to hike their target range by 25 basis points, to 5.00-5.25%. This marked the tenth consecutive rate hike for the Fed, but what might be more important is that officials removed language suggesting that “additional policy firming may be appropriate.” Meaning: this could be the final rate hike of the cycle if the Fed sees encouraging signs from upcoming data.
Since the Fed’s hawkish period started in March 2022, US Inflation has come down from a more than 40-year high of 9.1% to 4.99%. The S&P 500 ended the year down 18% in 2022, but had rebounded 7.5% at the end of Q1 2023. Although US inflation is still higher than the Fed’s 2% target, other cracks in the economy, including three major bank failures this year, are being taken into consideration when determining the Fed’s next steps. Fed officials also stated they expect no rate cuts to occur until at least 2024. To put this cycle into context, the Target Federal Funds Rate went from 0% to its highest level in 15 years in a span of just 15 months.
On the surface, the Fed Funds Rate may seem like just one interest rate out of the many that exist in our complex financial world. However, there’s an old investing mantra that goes “Don’t Fight the Fed”. Meaning, it would be wise to align your investment choices with the actions of the Fed.
With that in mind, how powerful are the Fed’s decisions regarding monetary policy? What kind of effects do those decisions cast, and how do certain markets and sectors of the economy react to changes in the Fed Funds Rate? And now that we’re also possibly at the end of this hawkish cycle, what might that mean for investors?
What is the Federal Reserve and the Fed Funds Rate?
The Federal Reserve was created in 1913 under President Woodrow Wilson through the Federal Reserve Act. Known as “the Fed” for short, the central bank of the United States serves several purposes ranging from promoting stability in the financial system to regulating financial institutions and their activities. One of the Fed’s major functions is setting U.S. monetary policy in order to achieve its “dual mandate” set by Congress: maximum employment and long-term price stability (i.e. inflation) in the United States.
Monetary policy is set by a body within the Federal Reserve called the Federal Open Market Committee (FOMC). The FOMC usually meets eight times a year to review economic and financial conditions, and vote on changes to monetary policy. Policy is typically implemented via changes to the Fed Funds Rate, the benchmark rate at which financial institutions lend to each other.
If the FOMC deems that macroeconomic events warrant an increase to the Fed Funds Rate, such as inflation outpacing the Fed’s long-term target of 2%, the committee would raise the Fed Funds Rate to prevent the economy from overheating. If the economy appears to be stalling out, the FOMC may attempt to spur economic growth by lowering its target rate.
Whether the FOMC votes to raise the Fed Funds Rate, lower it, or keep it unchanged, each decision produces winners and losers throughout the economy. So which assets are most impacted by changes to the Fed Funds Rate?
How Bonds Are Affected by Fed Rate Hikes
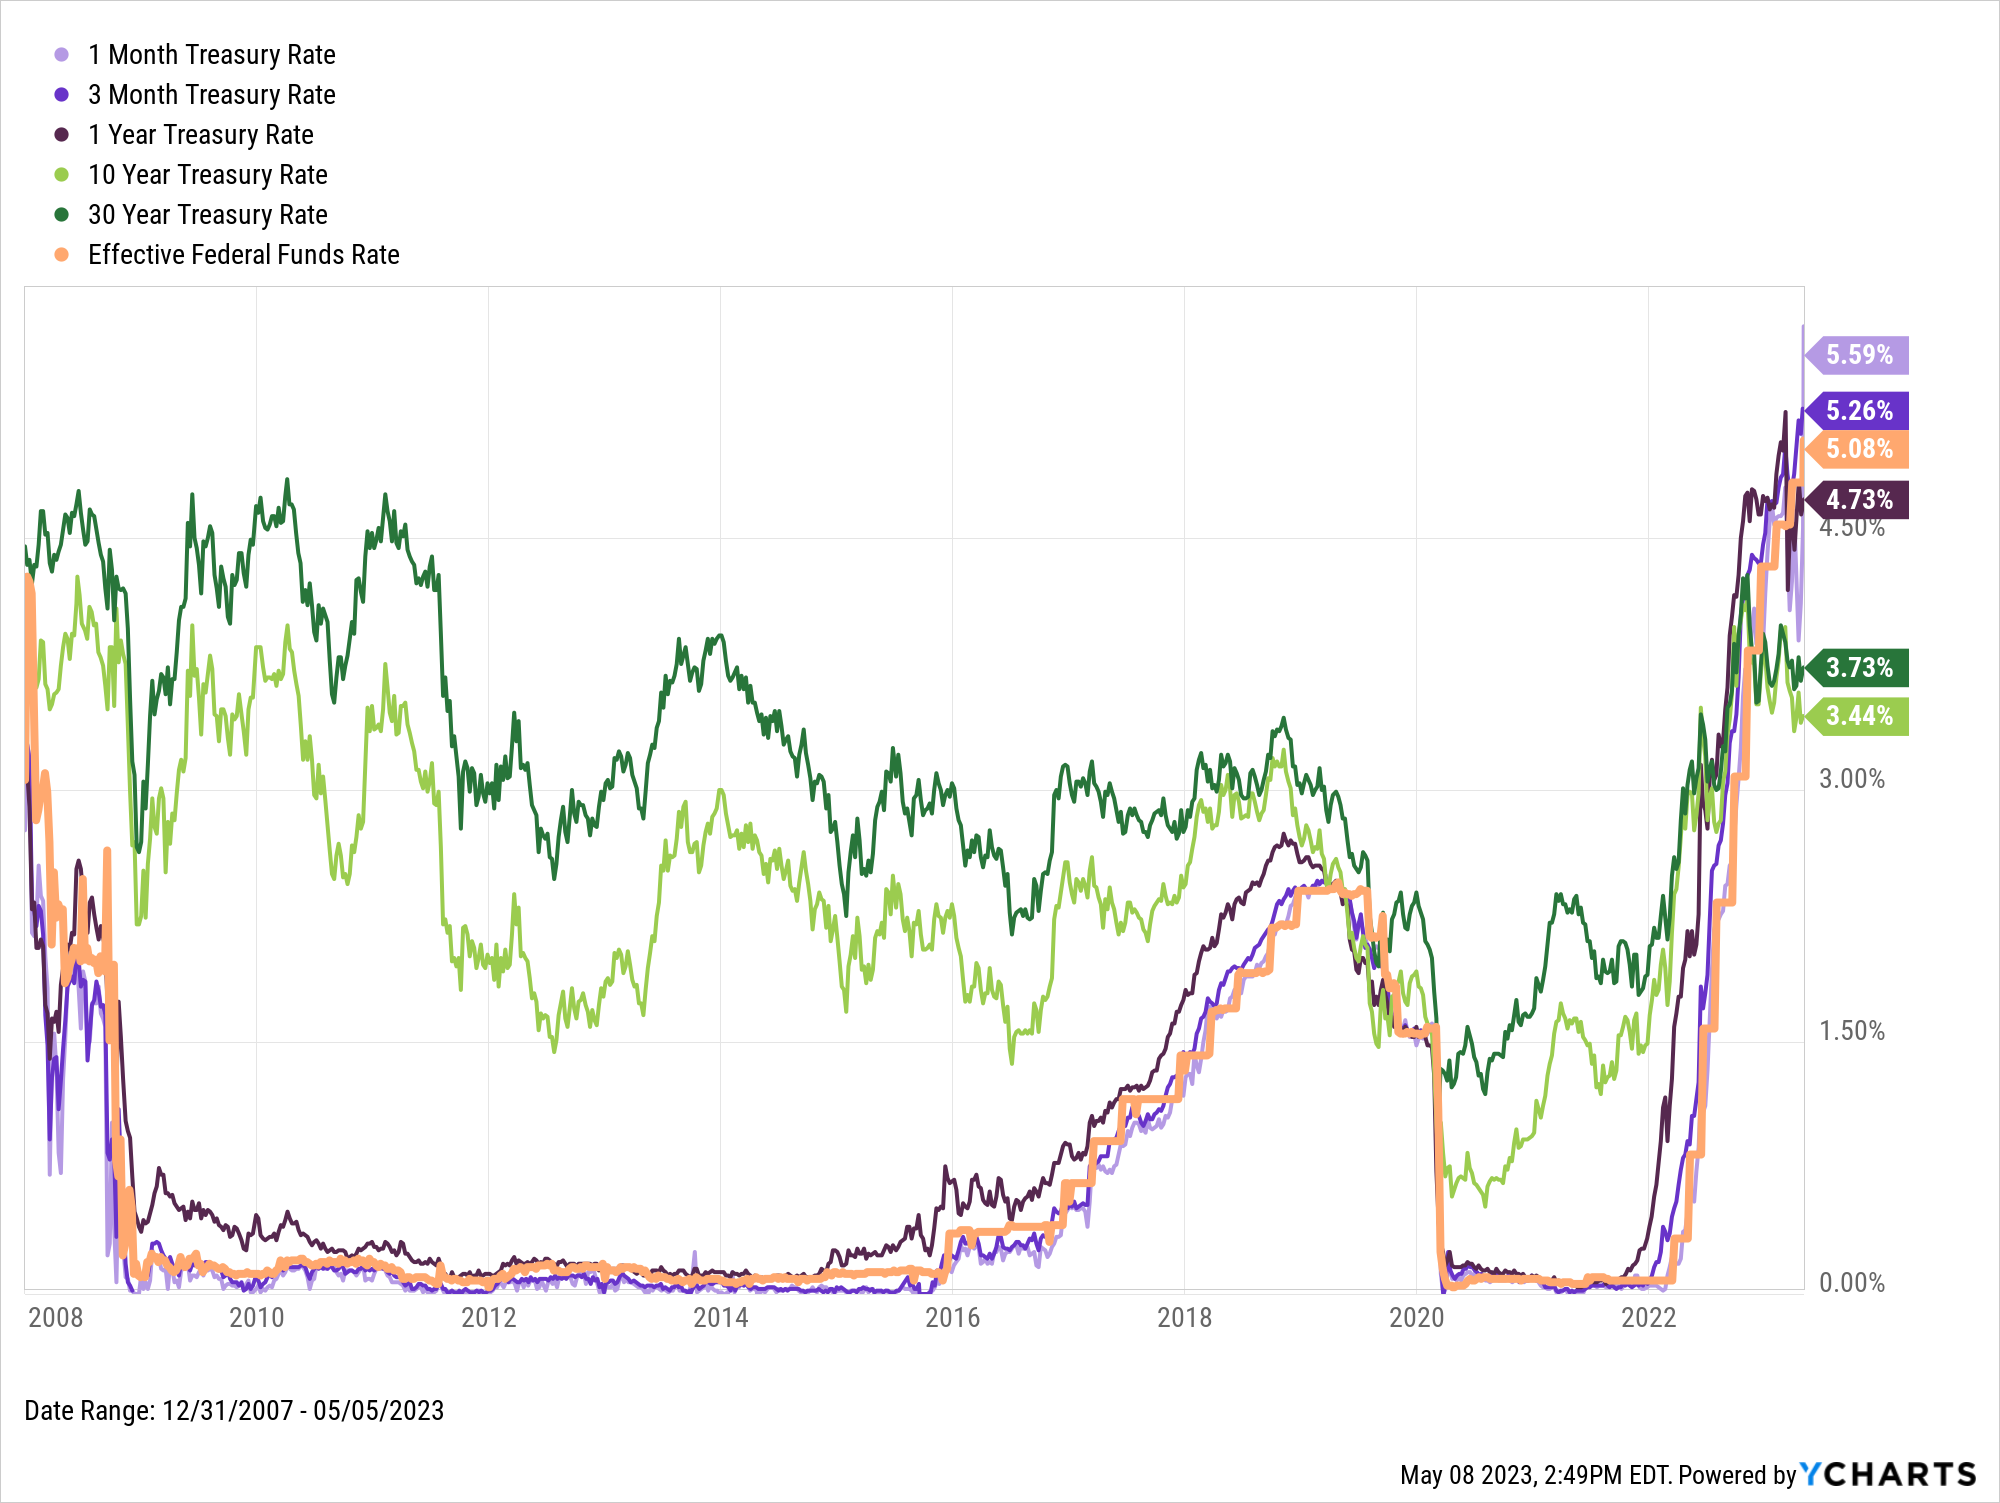
Short-term Treasury Bills, and the yields they can offer, are most directly affected by the Fed’s monetary policy, as stated by the Fed itself.
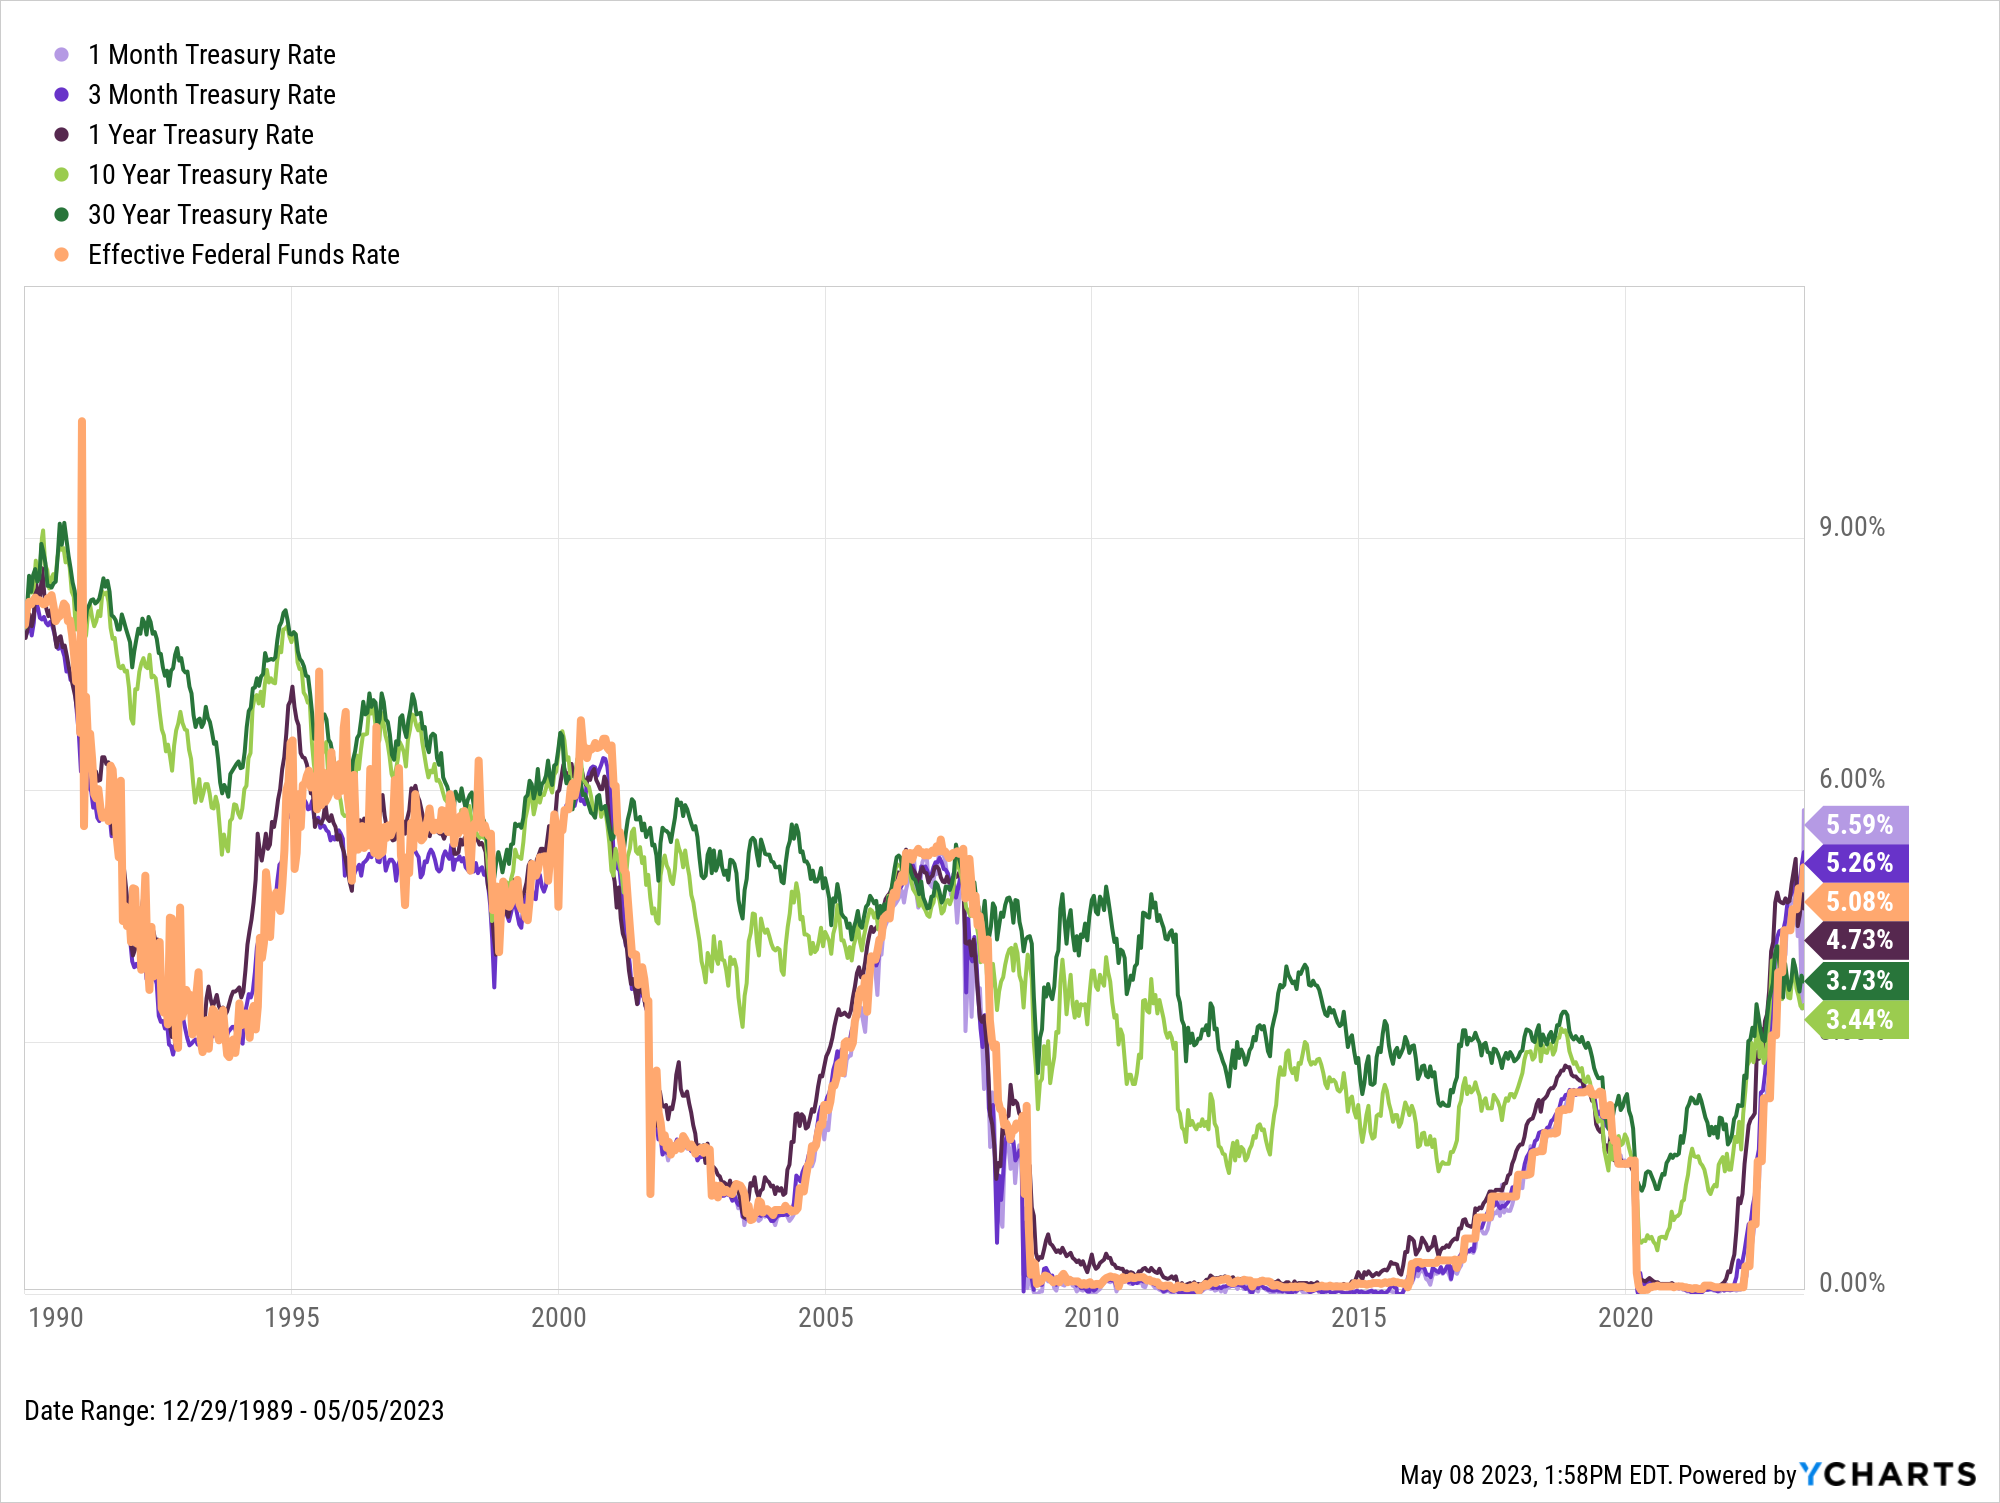
Though any fixed income instrument is subject to the ebbs and flows of the open market, short-term treasuries have historically moved in near lockstep with the Fed Funds Rate. This relationship is strongest for the 1-Month, 3-Month, 6-Month and 1-Year T-bills.
Longer-term treasuries, like the 10-Year Note and 30-Year Bond, don’t typically follow the Fed Funds Rate as closely, though they have trended along its general direction over the last 30 years. This is because the Fed does not directly target long-term interest rates and the maturities on these instruments are denoted years or even decades out in time (meaning their purchase prices and yields are subject to greater and more numerous potential risks).
It’s important to note that bonds’ market values typically decline as rates go up. In a rising rate environment, new bonds offering higher interest payments will be issued, causing existing ones to decline in price. If rate hikes were to pause, the prices of existing bonds could stabilize or even regain value, as their yields become increasingly competitive in comparison to newer offerings.
How Consumers Are Affected by Fed Rate Hikes
Prime Loan Rate
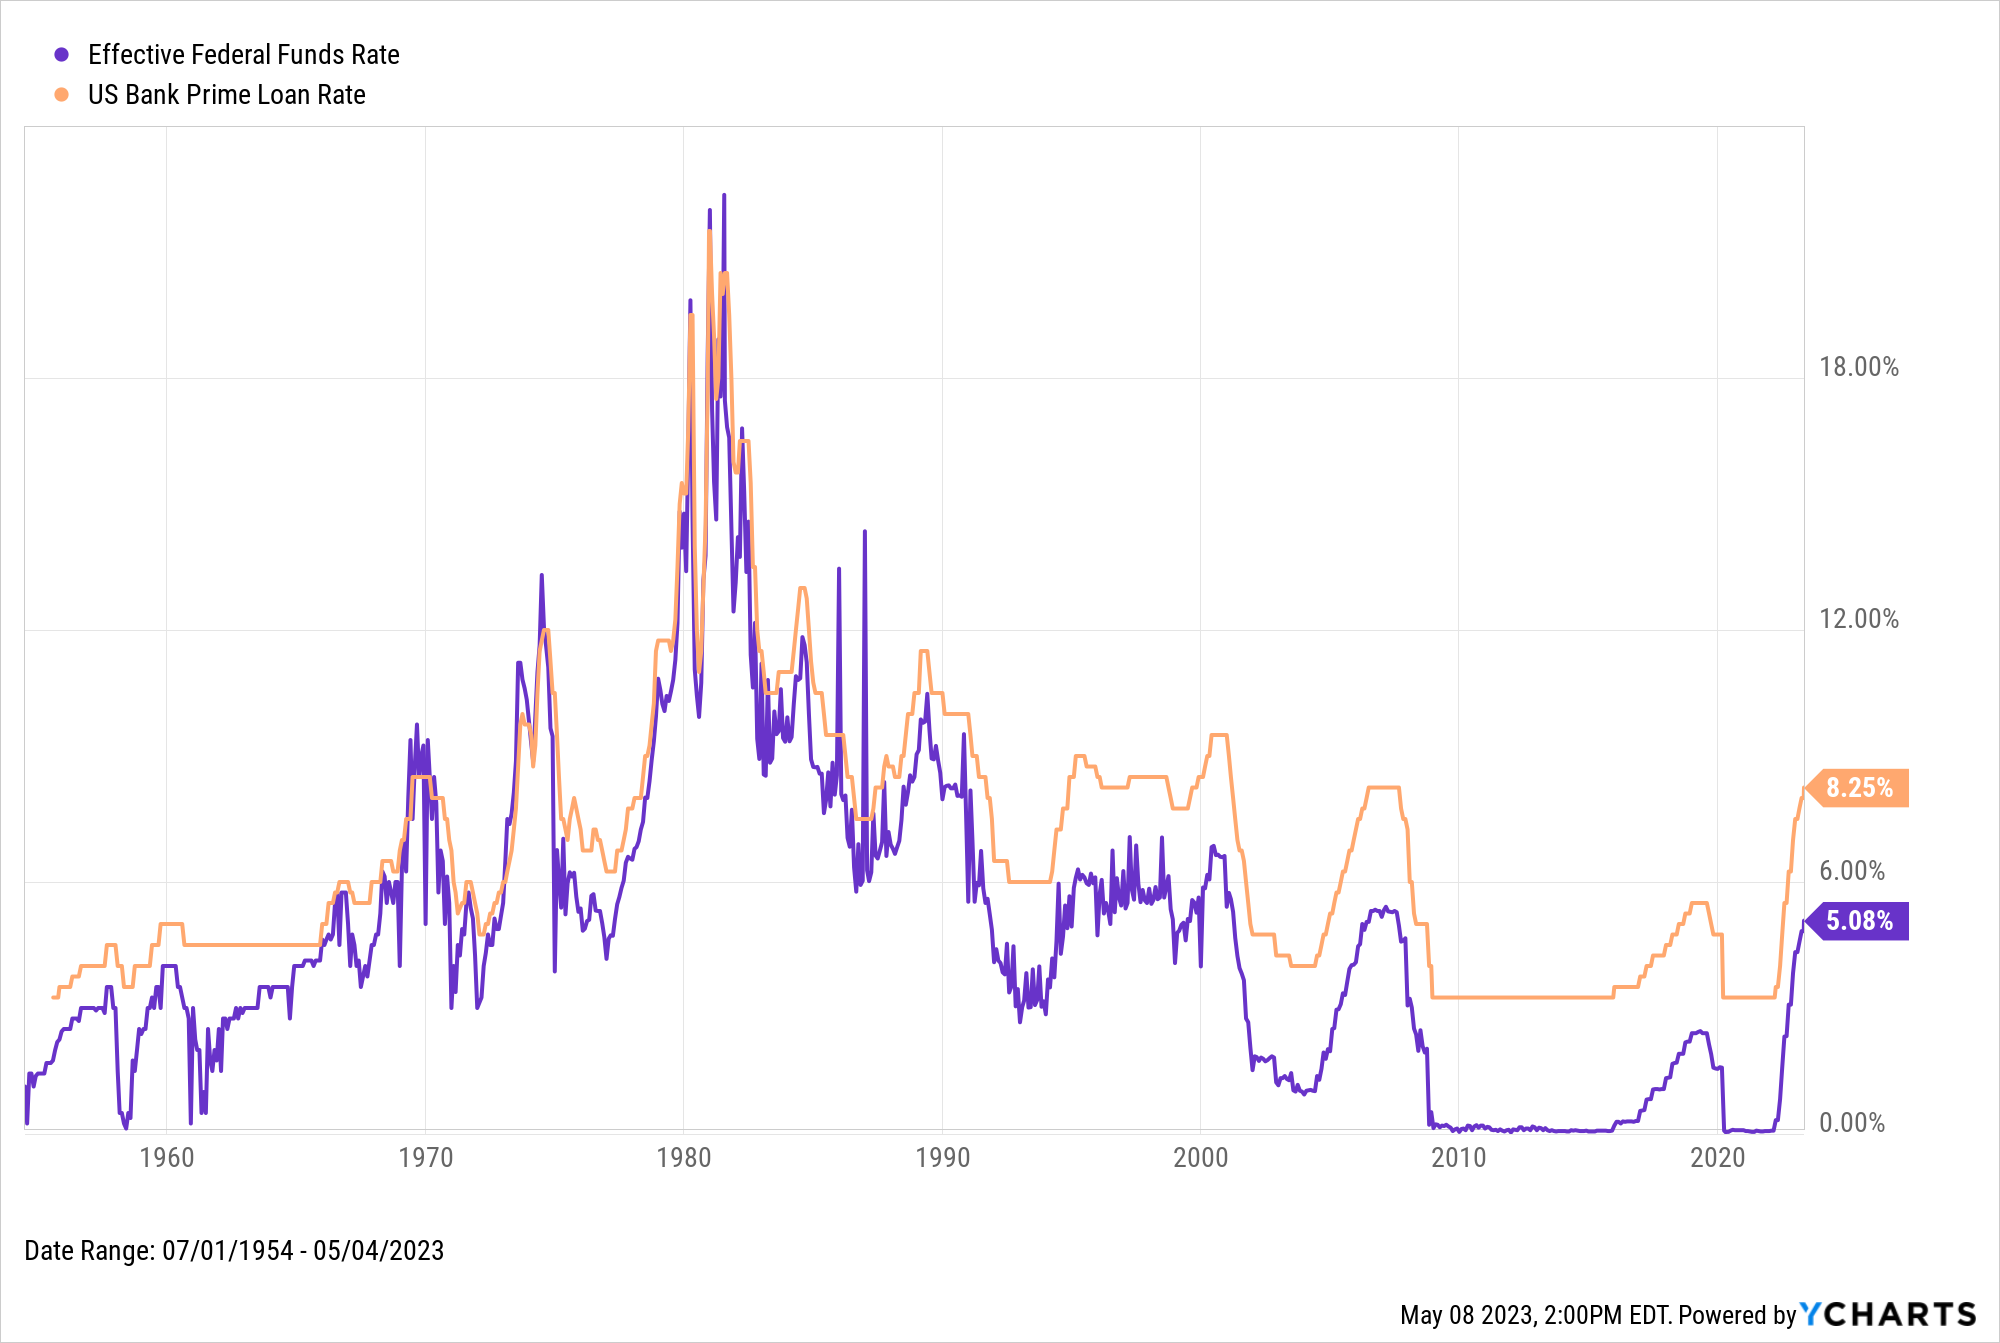
The Prime Loan Rate measures the rate at which banks lend to their most creditworthy clients. A rule of thumb for calculating the Prime Loan Rate is:
Target Fed Funds Rate + 3 points = Prime Loan Rate
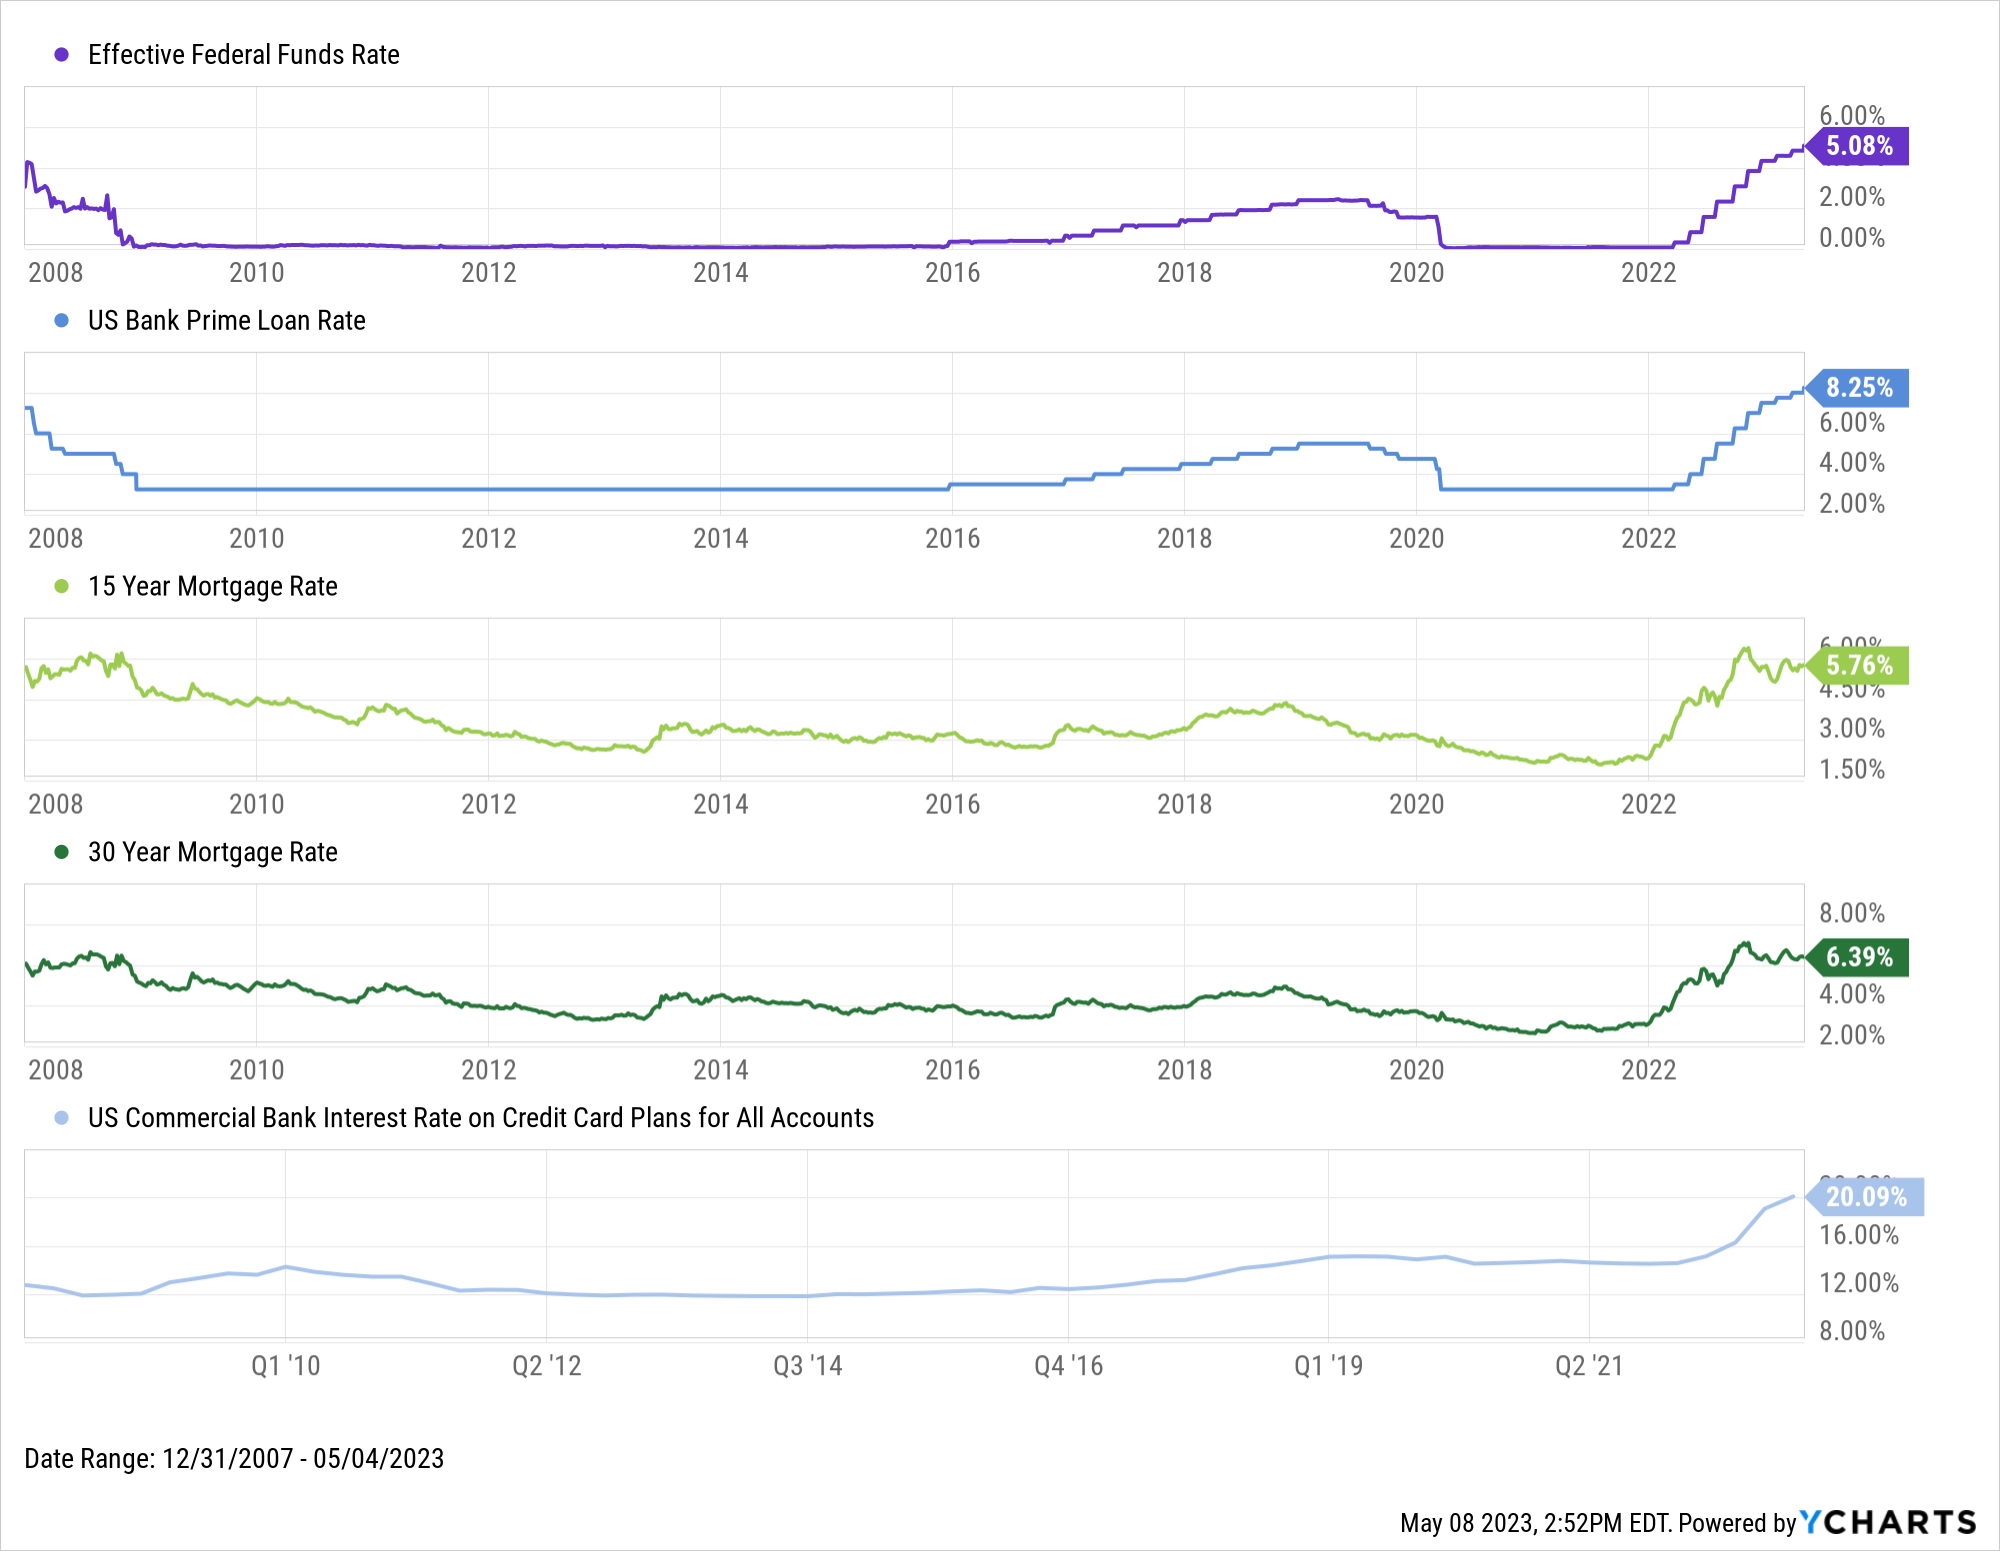
The US Bank Prime Loan Rate is strongly correlated with the Fed Funds Rate and tends to move along with it, as seen in the chart below. Any further Fed rate hikes are quite likely to increase the amount Prime Loan Rate borrowers are charged. If rate hikes were to pause, the US Bank Prime Loan Rate may stabilize or even experience a slight decrease, leading to more predictable borrowing costs for consumers and businesses, potentially stimulating economic activity.
Credit Card Interest
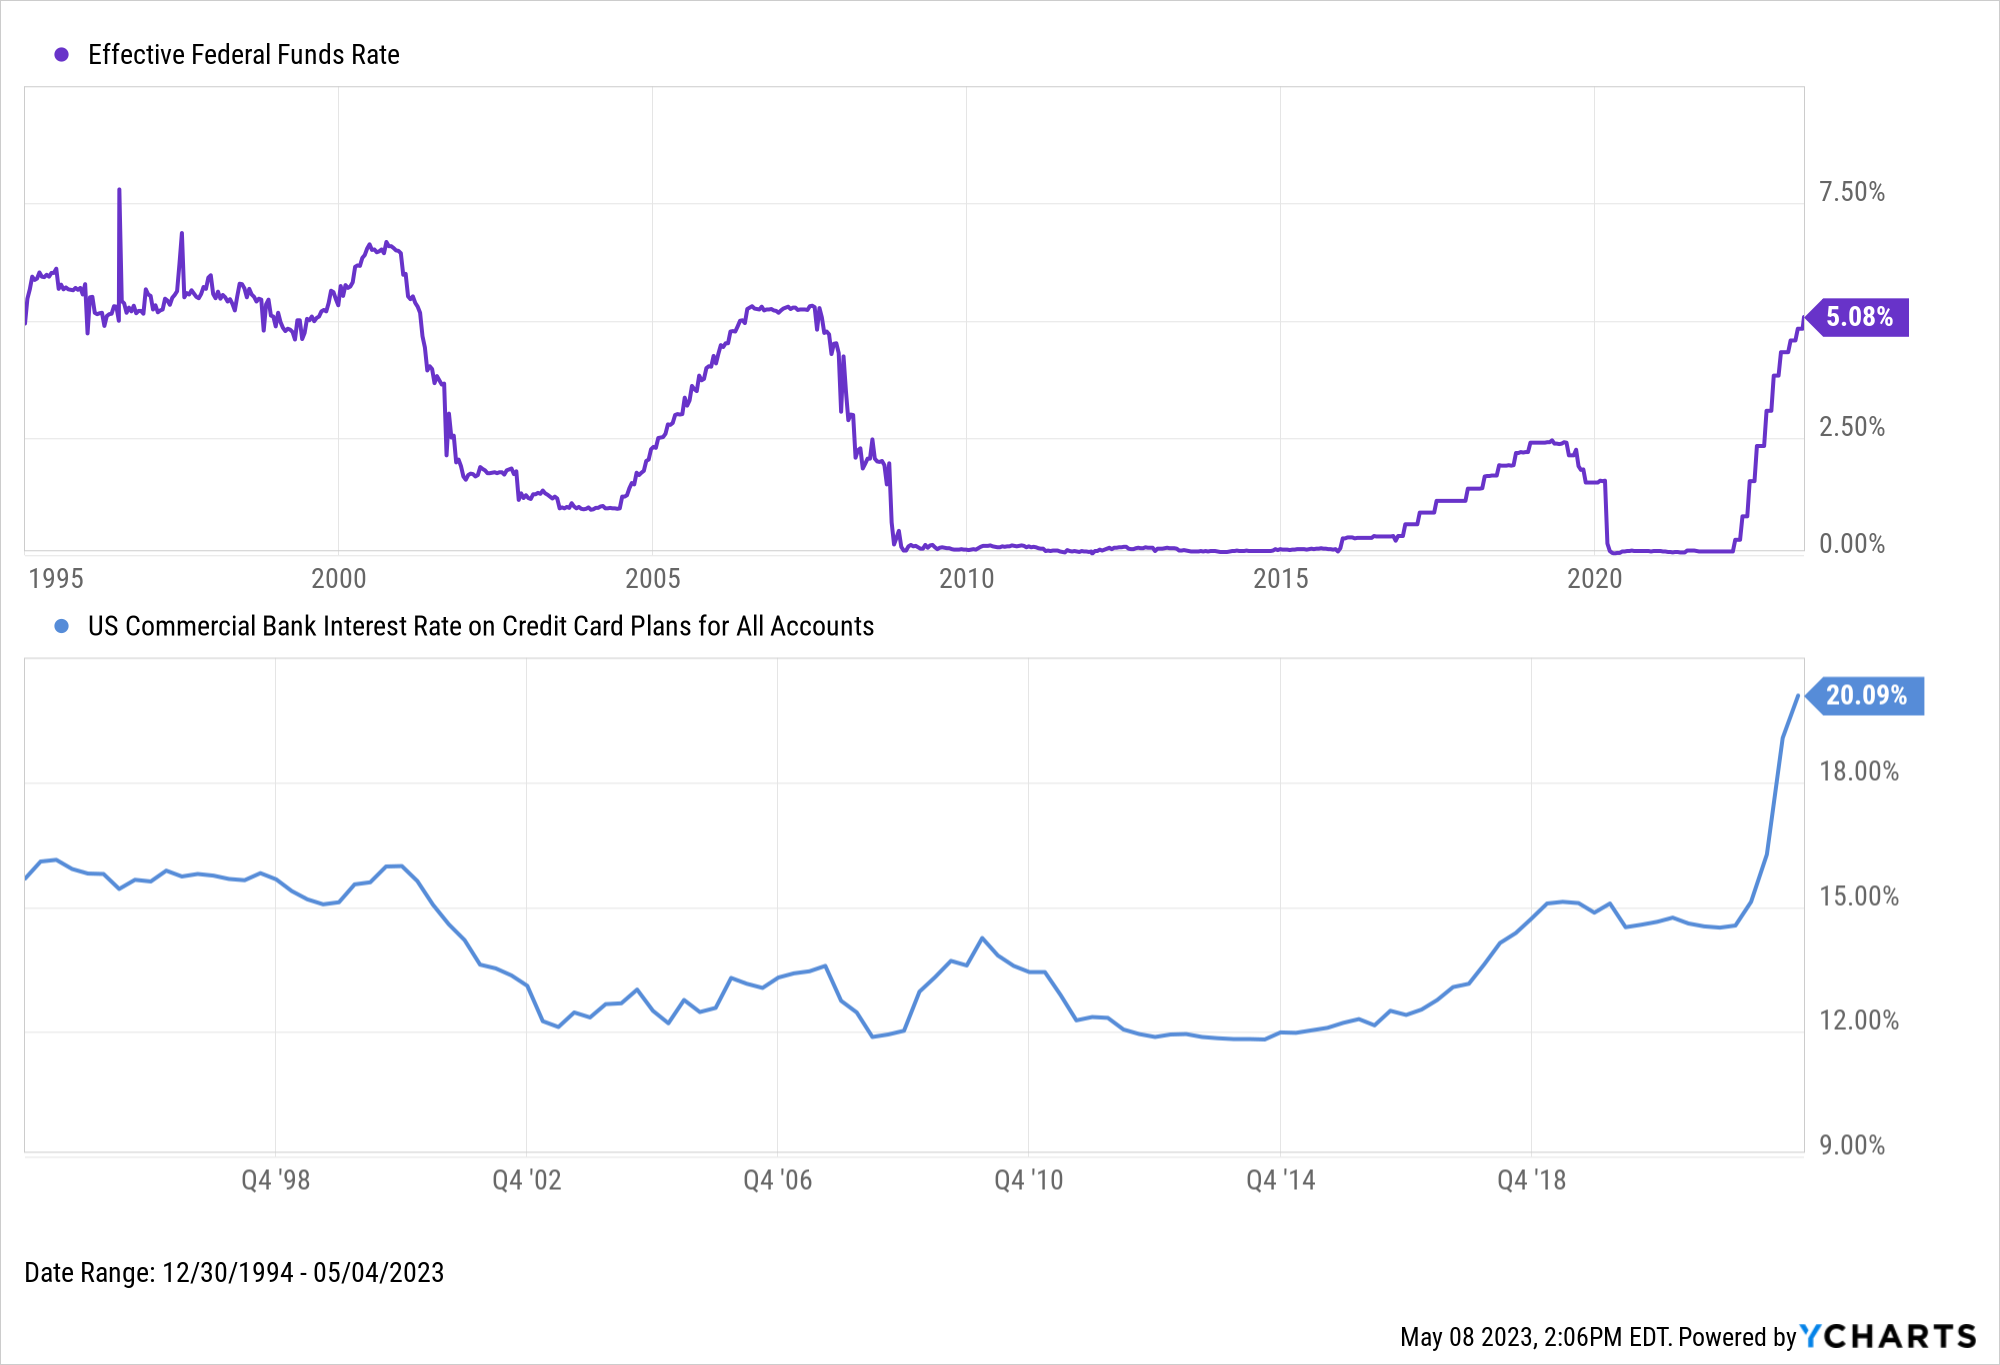
Changes to the Fed Funds Rate can also influence credit card interest rates, known to all of us as Annual Percentage Rate (APR).
The relationship between the Fed Funds Rate and credit card interest rates is relatively strong historically, but since 2003 the average APR has been less directly affected by rate changes. While credit card interest rates rose with the Fed Funds Rate starting in 2015, they lowered only slightly when the Fed cut rates to 0%, unlike previous low or zero-interest periods.
Credit card interest rates might not experience a significant change amid a pause in rate hikes due to their less direct correlation with the Fed Funds Rate since 2003. Nonetheless, a pause in rate hikes could potentially alleviate some upward pressure on APRs, providing relief to credit card holders and encouraging consumer spending.
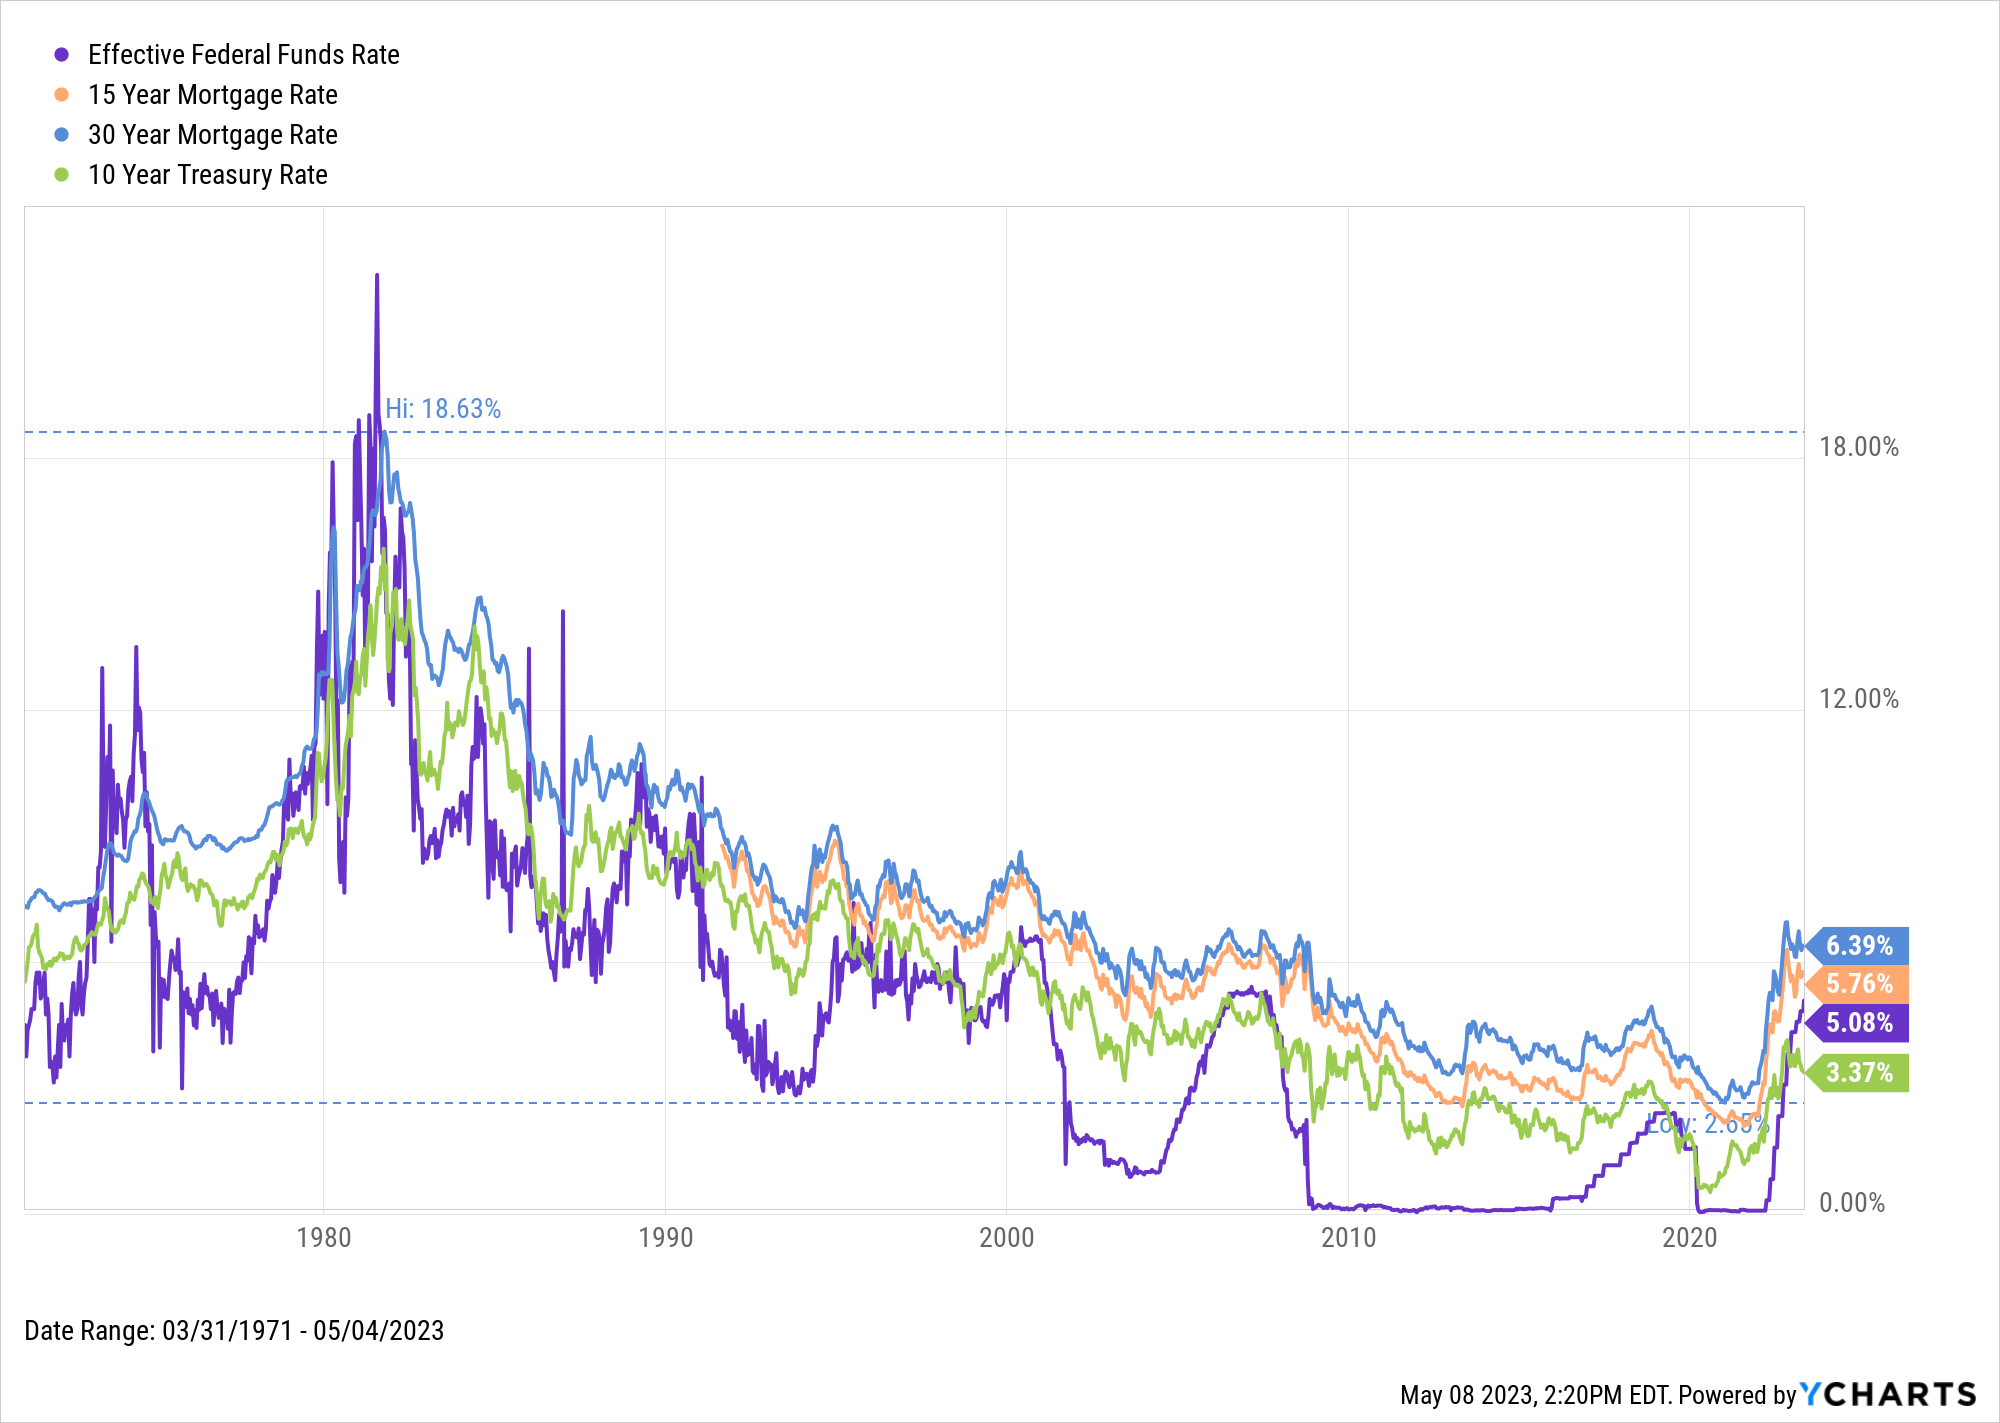
Mortgage Rates
The prevailing 30-Year Mortgage Rate, and its 15-Year counterpart, tend to follow the 10-Year Treasury Rate more so than the Fed Funds Rate. Mortgages are backed by bonds and securities, which align more with an instrument like the 10-year treasury. The Fed doesn’t directly target long-term instruments, but since rates of most shapes and sizes experience a ripple effect from the Fed’s actions, mortgage rates tend to do the same.
Since February 2022, the 30-Year mortgage rate has climbed 2.5 percentage points to 6.39%. If the current rate hike cycle ends, the 30-Year Mortgage Rate and its 15-Year counterpart might experience a period of stabilization or even a slight decrease, as the 10-Year Treasury Rate could also stabilize or decline. This could lead to more favorable mortgage conditions for homebuyers.
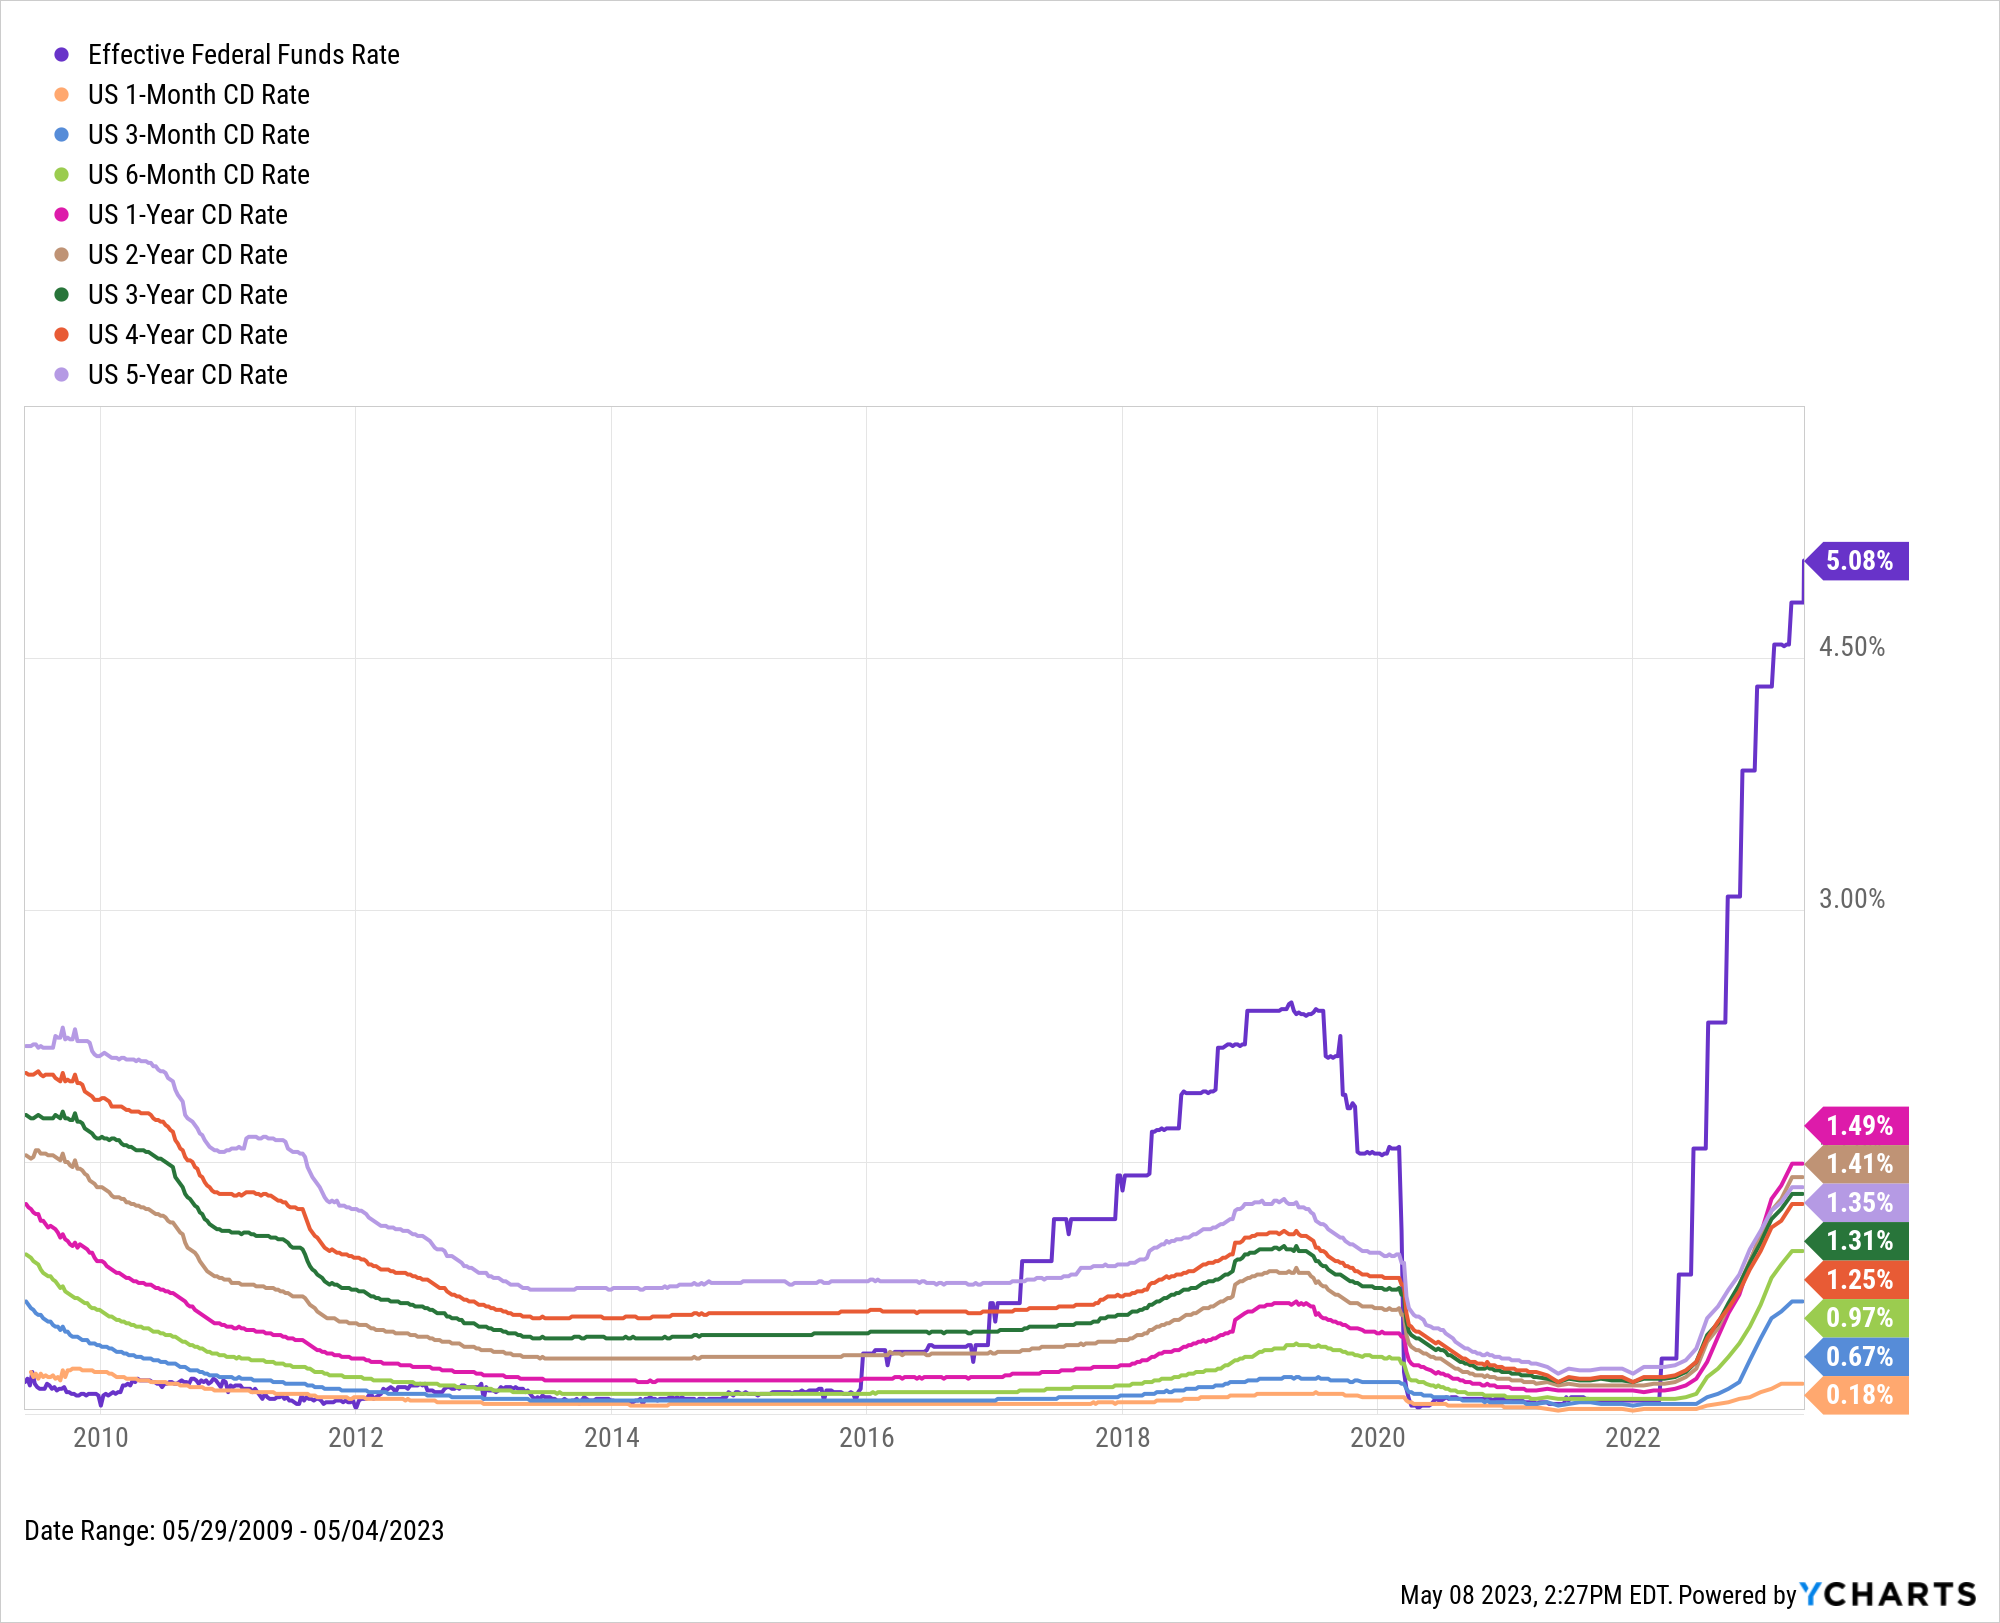
Savings Accounts & CDs
One group that stands to benefit from Fed Rate hikes are savers, or depositors. When banks compete for individuals’ deposits, they often incentivize potential customers by raising interest rates on savings accounts and certificates of deposits (CDs). CD rates rose in response to Fed rate hikes in 2015 and through 2019, though they fell to extreme lows when the Fed Funds Rate went to zero in 2020. Nevertheless, the rates on savings accounts and CDs would be poised to receive bumps as the Fed Funds Rate is raised. Nevertheless, rates on savings accounts and CDs are seeing a bump as the Fed Funds Rate is being hiked.
During this rate-hiking cycle, many investors began parking their money because of competitive yields, evidenced by the $439B that flowed into money market funds in Q1 2023.
In the event of a pause in rate hikes, however, savers might see a period of stalled interest rates on savings accounts and CDs, as banks would have less incentive to compete for deposits with higher rates. In response to the slower growth of interest rates, individuals could potentially seek alternative investment options to achieve better returns, which might impact the overall investment landscape.
How Stocks Are Affected by Fed Rate Hikes
When the Fed raises rates, the cost of borrowing increases for businesses as well as individuals. Higher costs and cutbacks on capital expenditures could mean lower top and bottom lines for corporations, and thus reduced stock prices. Companies that rely on cheap access to capital, often growth-focused companies, may find it more difficult to finance expansion, and therefore become less able to justify their current valuations.
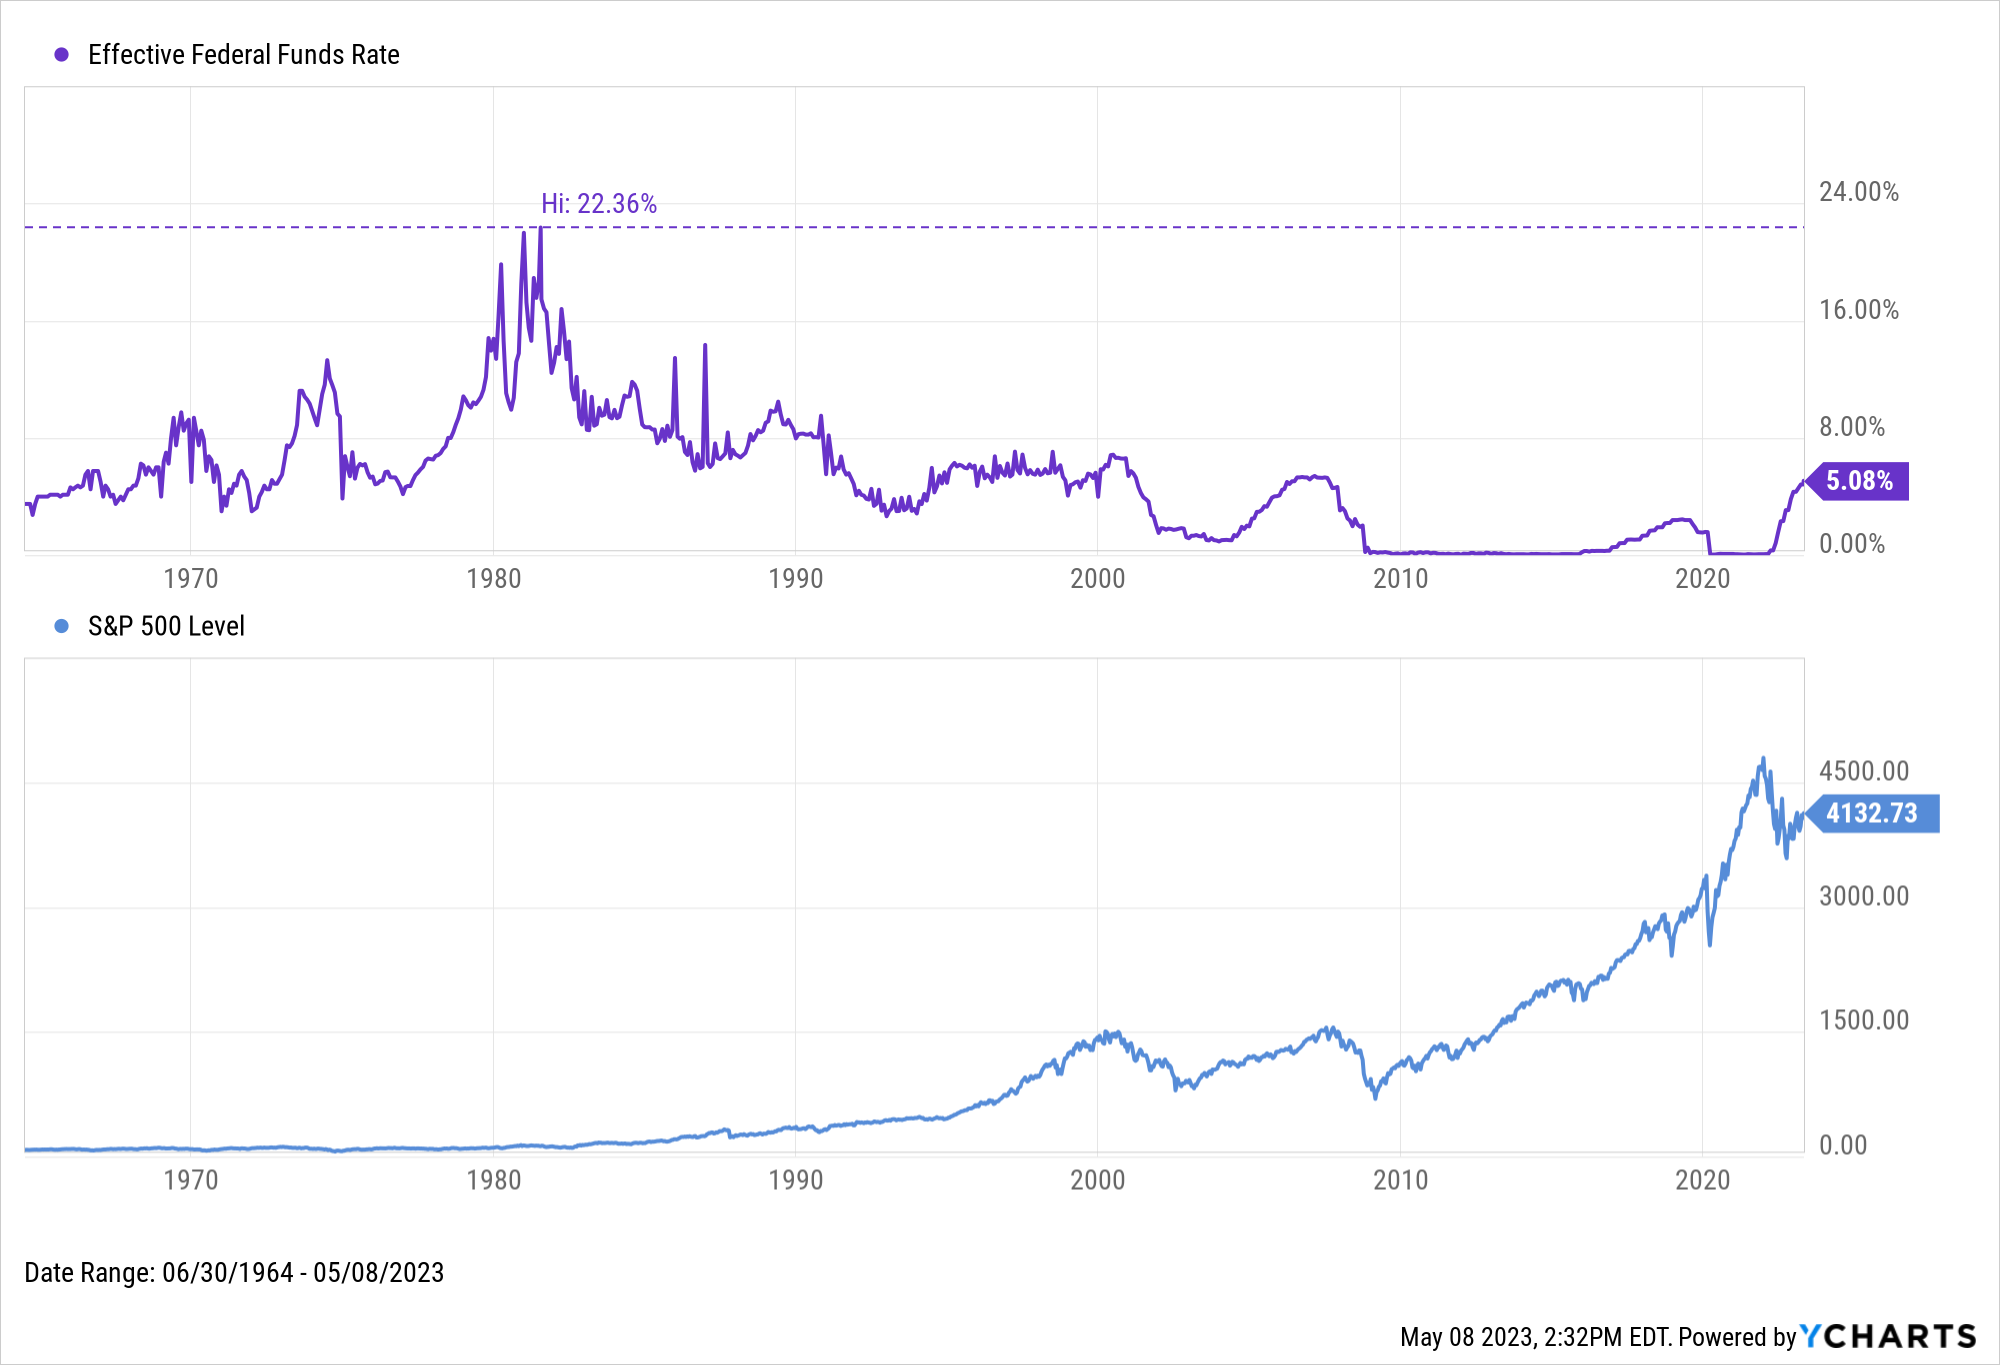
Stocks have thrived significantly in previous low-rate environments. In addition, the stock market started picking up steam as the Fed Funds Rate fell from its peak in 1981. The S&P 500 has risen 8.6% on an annualized basis since then, but with the index’s dreadful 2022 in the rearview, investors will be watching to see how the ongoing rate hike cycle affects the market’s direction. Of note, equity investors may still welcome a Fed Rate hike if it’s meant to combat the strong headwind of rising inflation.
A pause in rate hikes could help maintain or even boost current market momentum, offering opportunities for investors to capitalize on equities, and providing companies with more attractive financing options. However, if the pause in rate hikes unsuccessfully addresses rising inflation it could erode the real value of returns. A restart of hikes may make investors less eager to invest in equities.
Comparing The Two Times Rates Were Raised from 0%
In December of 2015, the Fed began raising rates from the 0.00-0.25% target in light of sustained economic activity, a continued decline in unemployment, and expectations that inflation would rise to a 2% average. Three years later, the Fed stopped raising rates at a target range of 2.25-2.50% after inflation hovered around that 2% target for several months. The Fed gradually raised rates in 25 basis point increments through December 2018.
This cycle has seen the Fed raise rates more aggressively. This recent cycle included 75 basis point hikes on four occasions between May and November 2022, along with a couple of 50 basis point hikes at both ends of that time frame. After its most recent rate hike some analysts believe the Fed has reached their “terminal rate” projection of 5.25%.
Because the Fed Funds Rate has been set to zero only twice in history, 2022 also brought the second instance ever in which the Fed has raised rates from 0%. With all this in mind, how have different asset classes and indicators fared under the rate hike cycle of 2015-2018 compared to 2022?
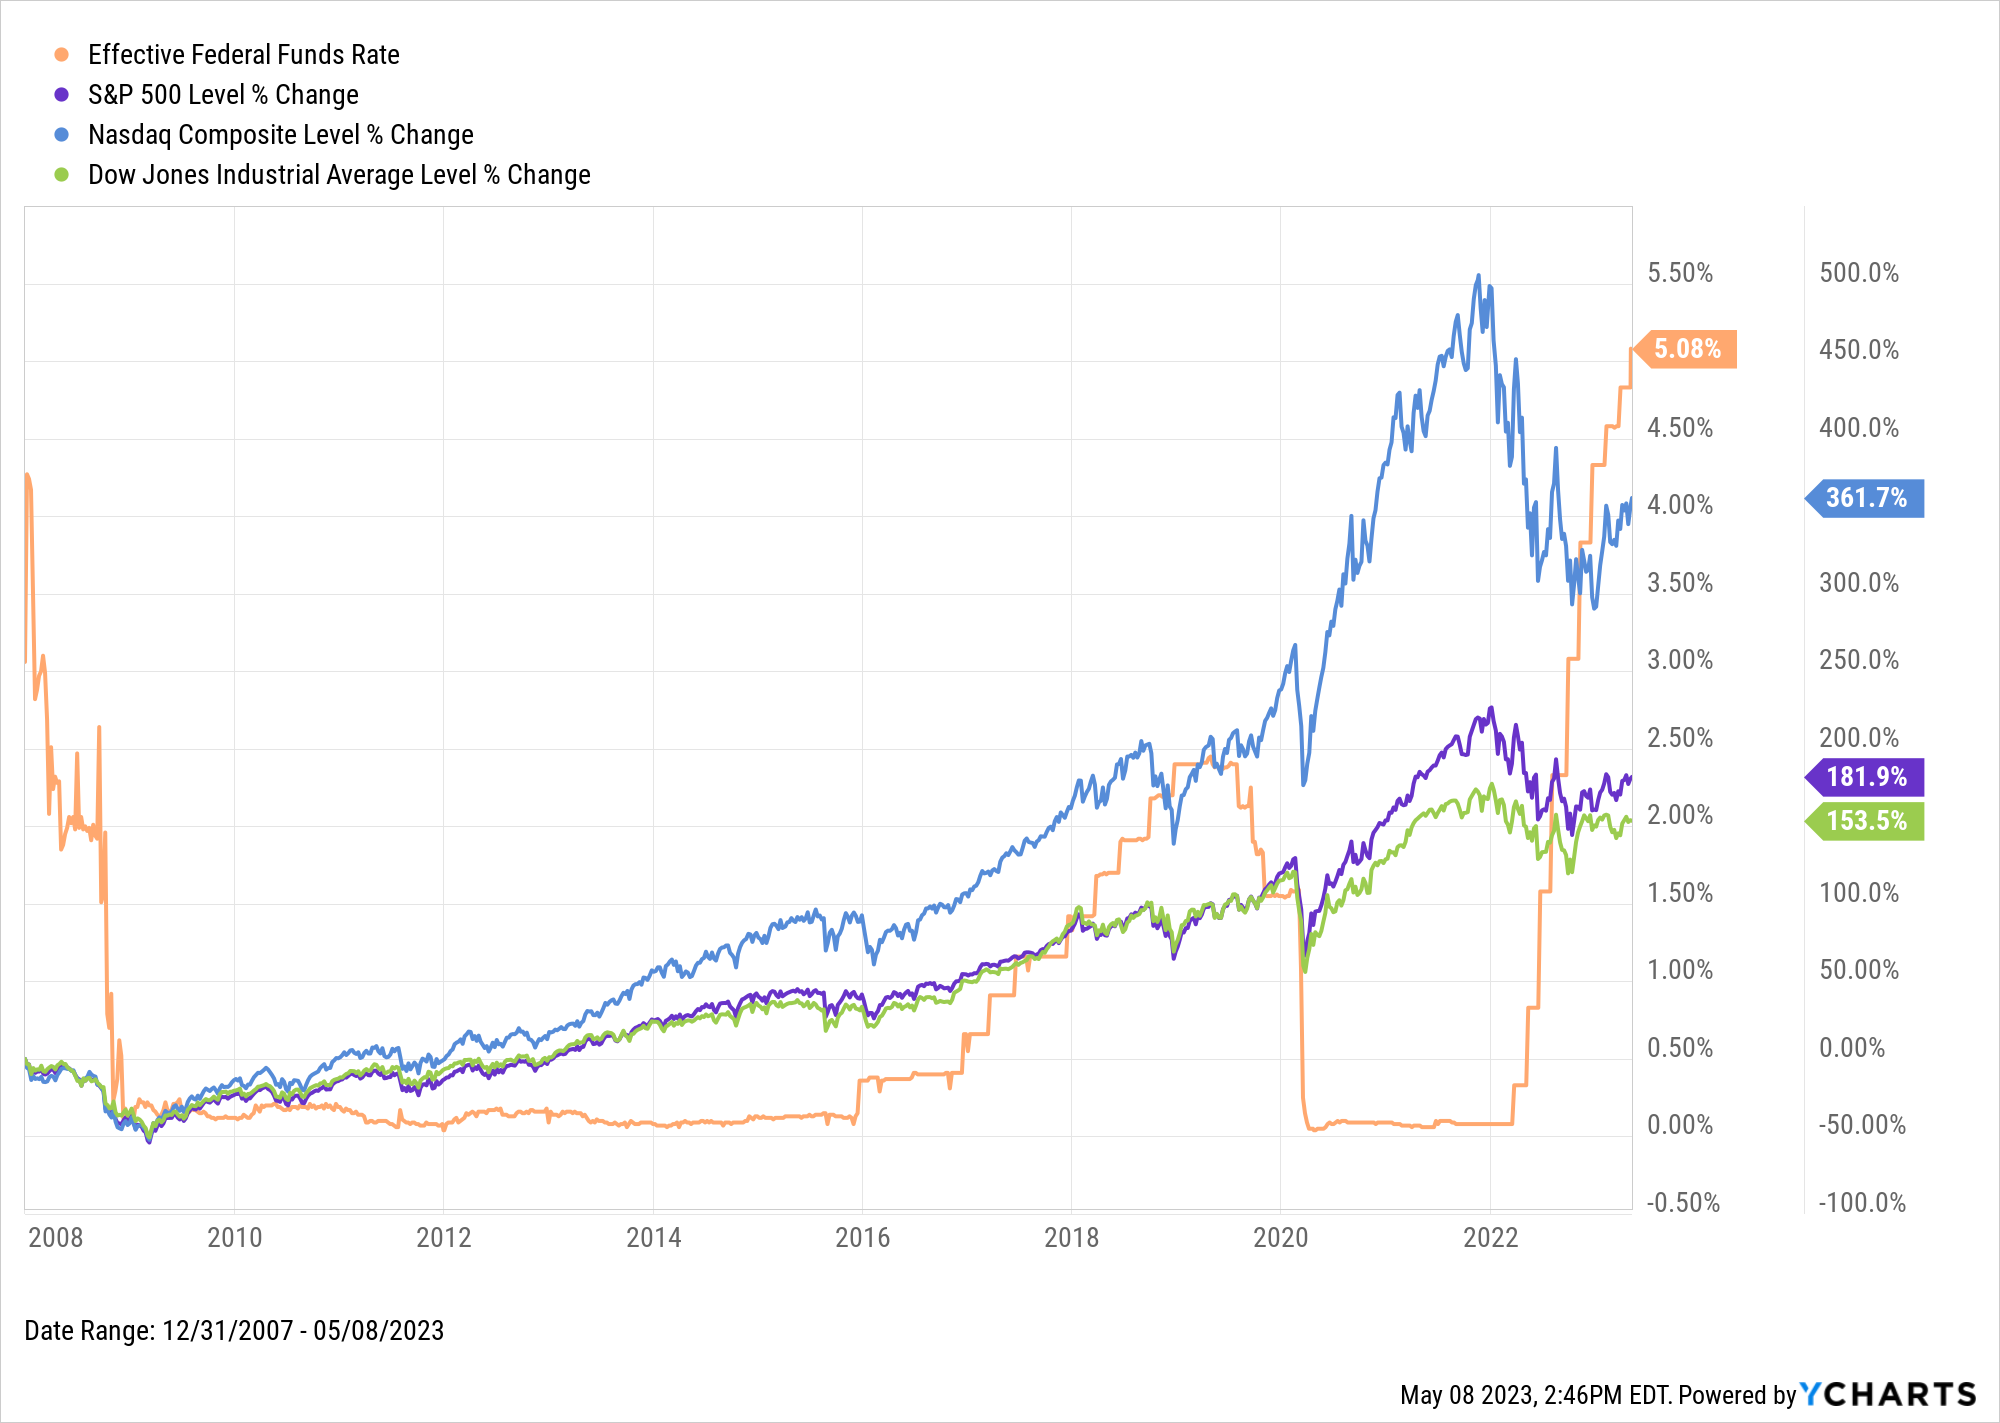
What Happened to Stocks When the Fed Funds Rate Was Raised from 0%?
After the Federal Funds Rate effectively reached 0% at the end of 2008, US stock indexes entered a bull market that would last more than a decade. It was a largely uninterrupted bull market for the Dow Jones Industrial Average, S&P 500, and especially for the growth-heavy NASDAQ thanks in part to the “cheap money” provided by near-zero rates.
Around the time of the initial rate hikes in 2015, the indexes fell sharply on back-to-back occasions, but then continued to charge higher for a number of years during the Fed’s rate hike cycle. When rates reached 2% in 2018, there was a sizable correction late in the year. That correction also occurred just before the Fed ceased raising rates at 2.5%.
At the onset of the COVID-19 pandemic, when the Fed lowered its target range to 0.00-0.25% once again, the indexes switched back into bull market mode. Largely mirroring what happened at the end of 2008, the NASDAQ outpaced both the Dow and S&P 500 while rates were at 0%.
In 2022, the market started turning south just before the Fed began raising rates, partly because the Fed has become more vocal about their future plans. Though stark differences exist between the economic climates of the two rate hike cycles—inflation reaching over a 40-year high in 2022, among others— the Fed’s moves sent jitters through the markets in both cycles.
What Happened to Bonds When the Fed Funds Rate Was Raised from 0%?
As the Fed gradually raised rates starting in 2015, short-term treasury bills moved higher in tandem, while long-term bonds rose marginally as well. After the Fed rapidly raised rates in 2022, treasury yields of all shapes and sizes are shot higher in response.
What Happened to Consumers When the Fed Funds Rates Was Raised from 0%?
The interest rates on prime loans, mortgages, and credit cards all rose with the Fed Funds Rate during the hikes of 2015 through 2018. As mentioned earlier, mortgage rates have more closely tracked the 10-Year Treasury Rate. When the Fed stopped raising rates in 2018, mortgage rates actually fell. This was due in part to the Federal Reserve’s own concern over the possibility of slowing economic growth in 2019. With increased talk of a recession among both CEOs and the American public, could mortgage rates repeat history and trend downward, opposite to the trajectory of the Fed Funds Rate?
The Bottom Line
The Fed may be nearing the end of raising its benchmark Fed Funds Rate in an attempt to control inflation and stabilize prices in the US. The changes to this rate caused a variety of effects throughout financial markets. Some areas of the economy felt head-on impacts from the Fed Funds Rate, while others experienced lighter ripple effects. Whatever investments you own or are seeking to acquire, it pays to know the impacts of the Fed Funds Rate so you don’t find yourself “Fighting the Fed”.
Source: What Happens After A Fed Rate Hike? (Or Pause)? - YCharts
Disclaimer
©2023 YCharts, Inc. All Rights Reserved. YCharts, Inc. (“YCharts”) is not registered with the U.S. Securities and Exchange Commission (or with the securities regulatory authority or body of any state or any other jurisdiction) as an investment adviser, broker-dealer or in any other capacity, and does not purport to provide investment advice or make investment recommendations. This report has been generated through application of the analytical tools and data provided through ycharts.com and is intended solely to assist you or your investment or other adviser(s) in conducting investment research. You should not construe this report as an offer to buy or sell, as a solicitation of an offer to buy or sell, or as a recommendation to buy, sell, hold or trade, any security or other financial instrument. For further information regarding your use of this report, please go to: ycharts.com/about/disclosure